How do you cut energy usage right at the source, at the back of the server racks? That’s the core question Ethernetics set out to answer. In data centers and telecom environments, where electricity can account for up to 80% of operating costs, even a 5% reduction makes a massive difference. With their smart, AI-ready PDU (Power Distribution Unit), Ethernetics offers a scalable solution for monitoring and optimizing energy use, and needed a digital platform to support it. Together with icapps, they turned that vision into reality.
Challenge
Ethernetics needed a platform that speaks the language of business users. No overly detailed technical dashboards, just clear overviews, performance indicators, and easy-to-read visualizations. The goal? Show the difference between taking action and doing nothing, making the energy-saving impact visible, understandable, and worth investing in.
The solution
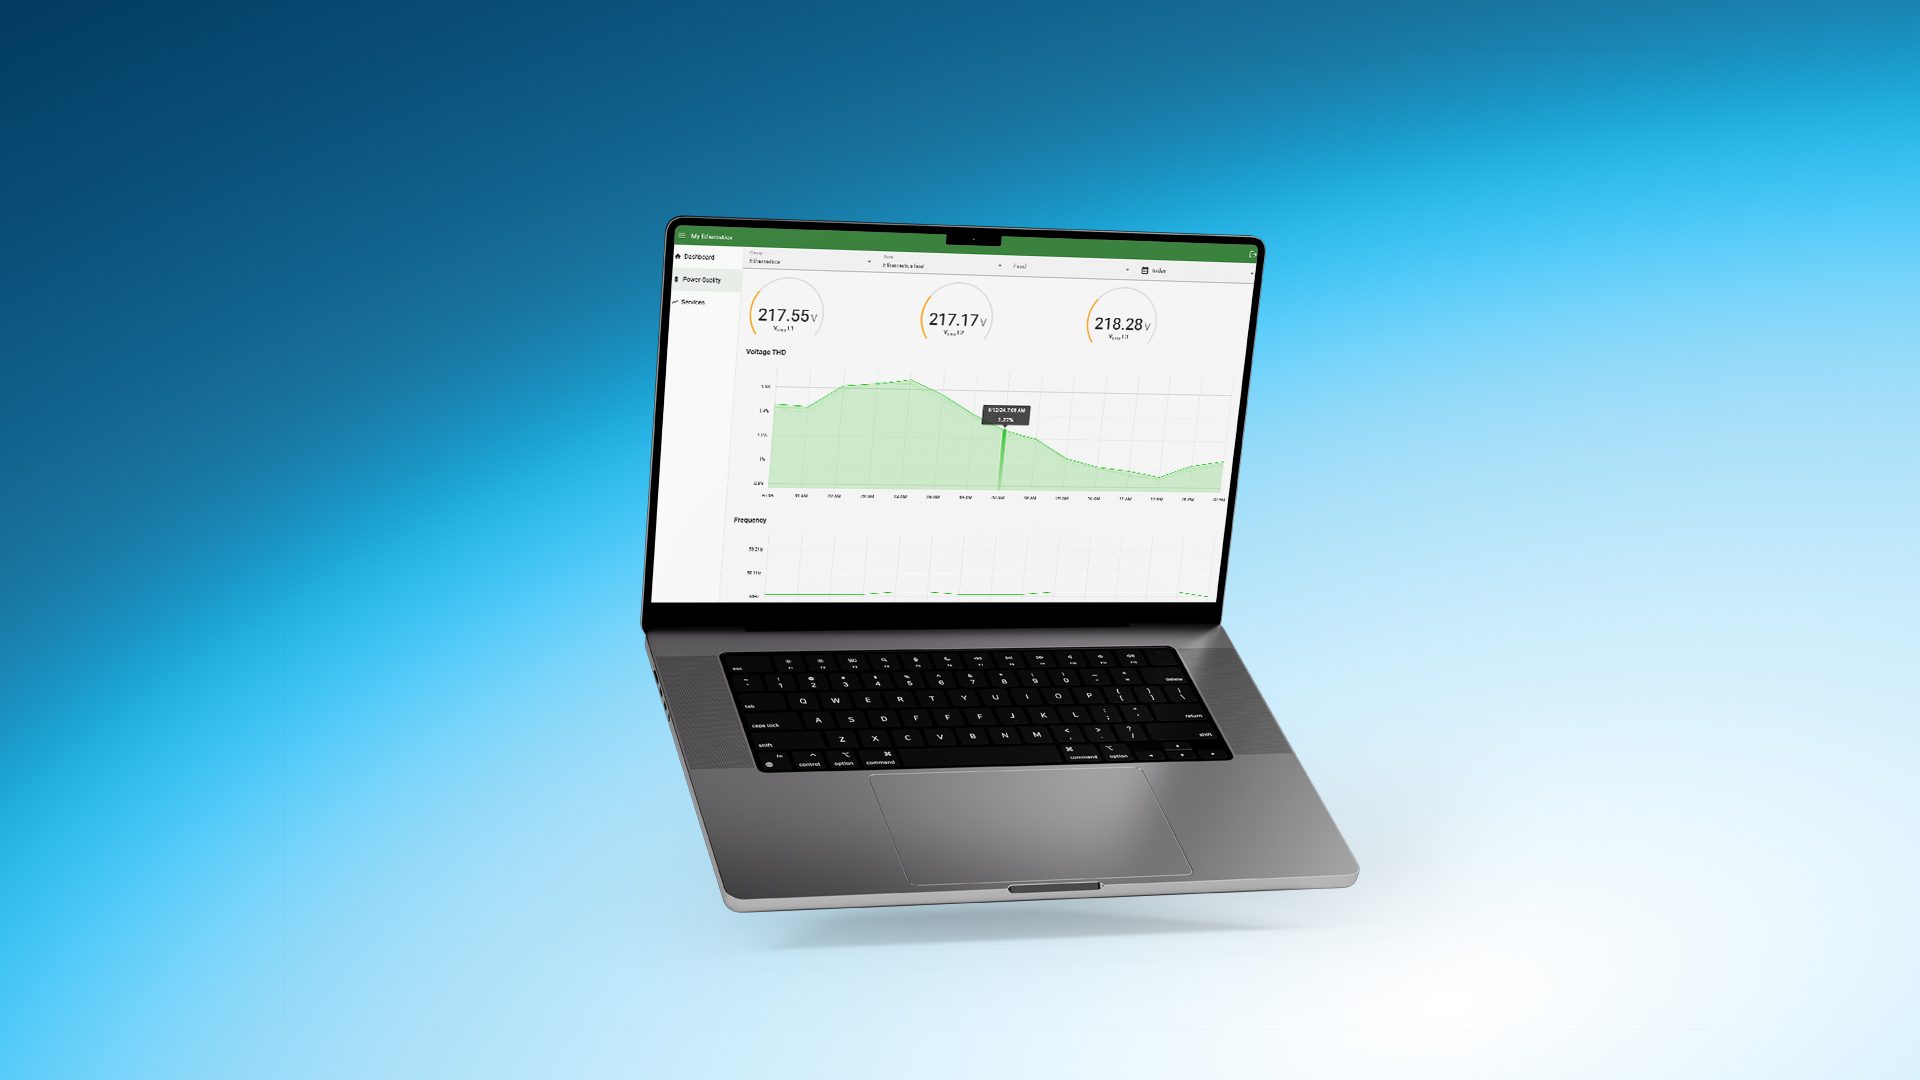
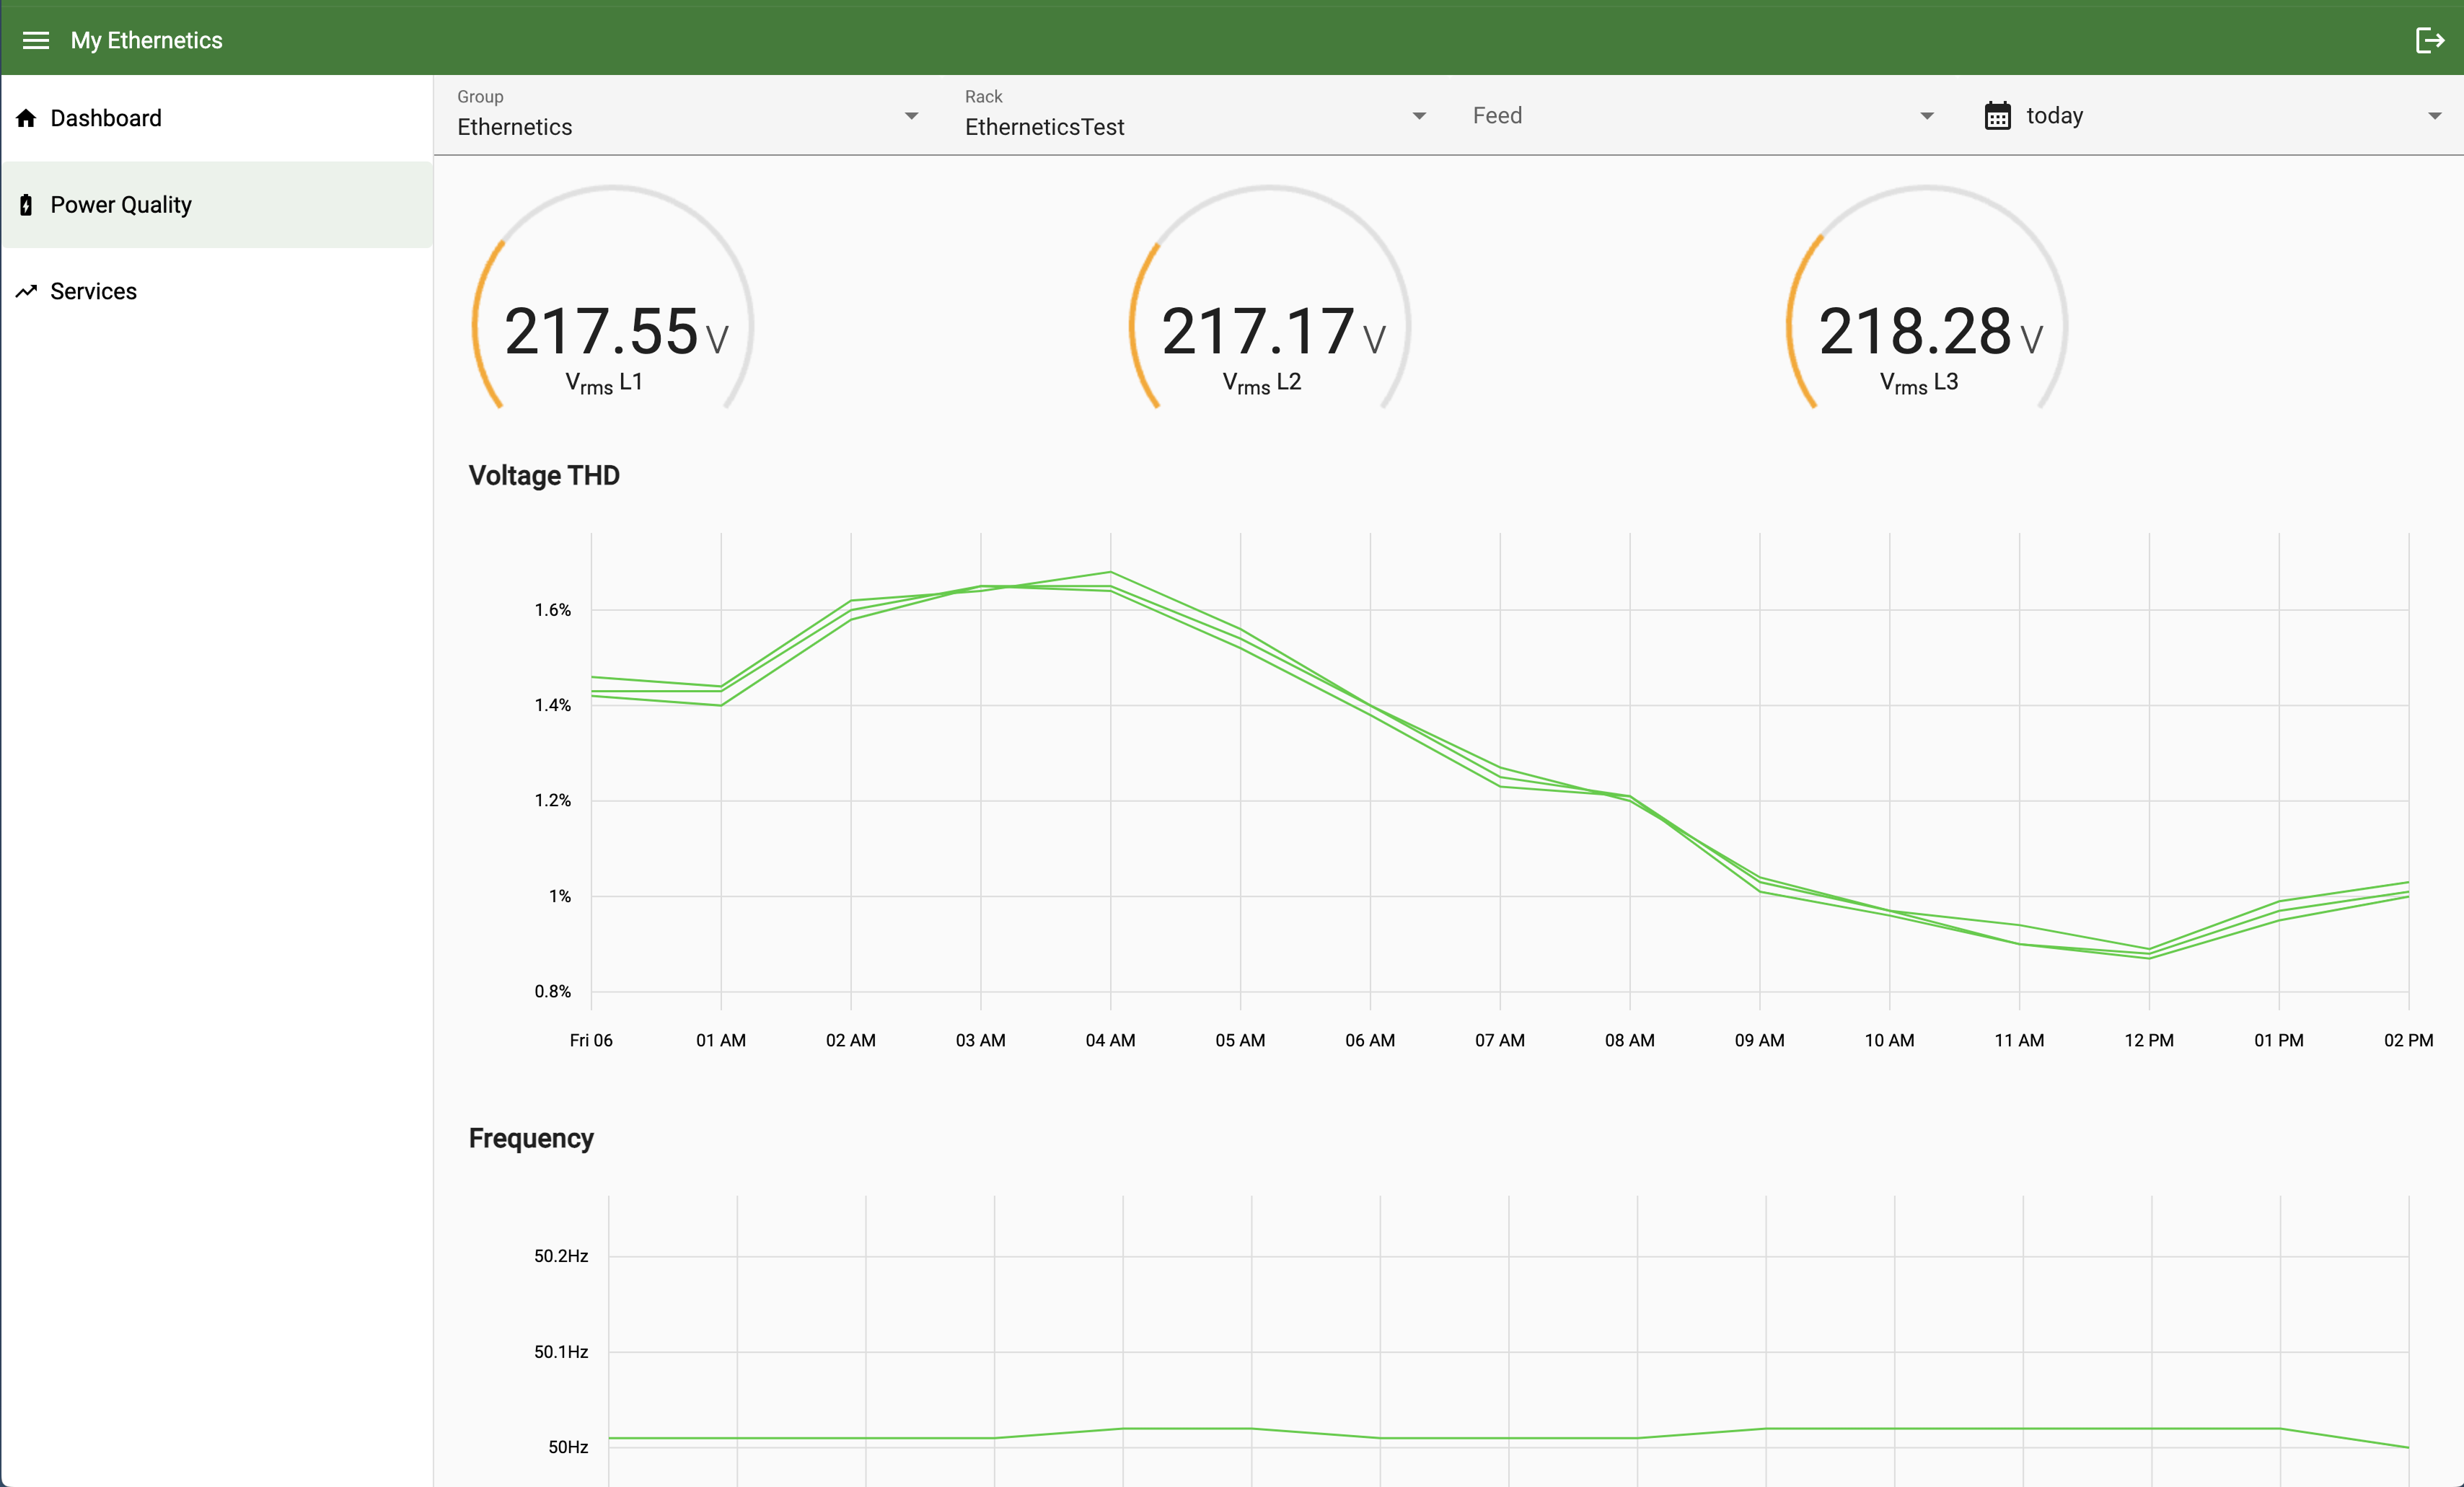
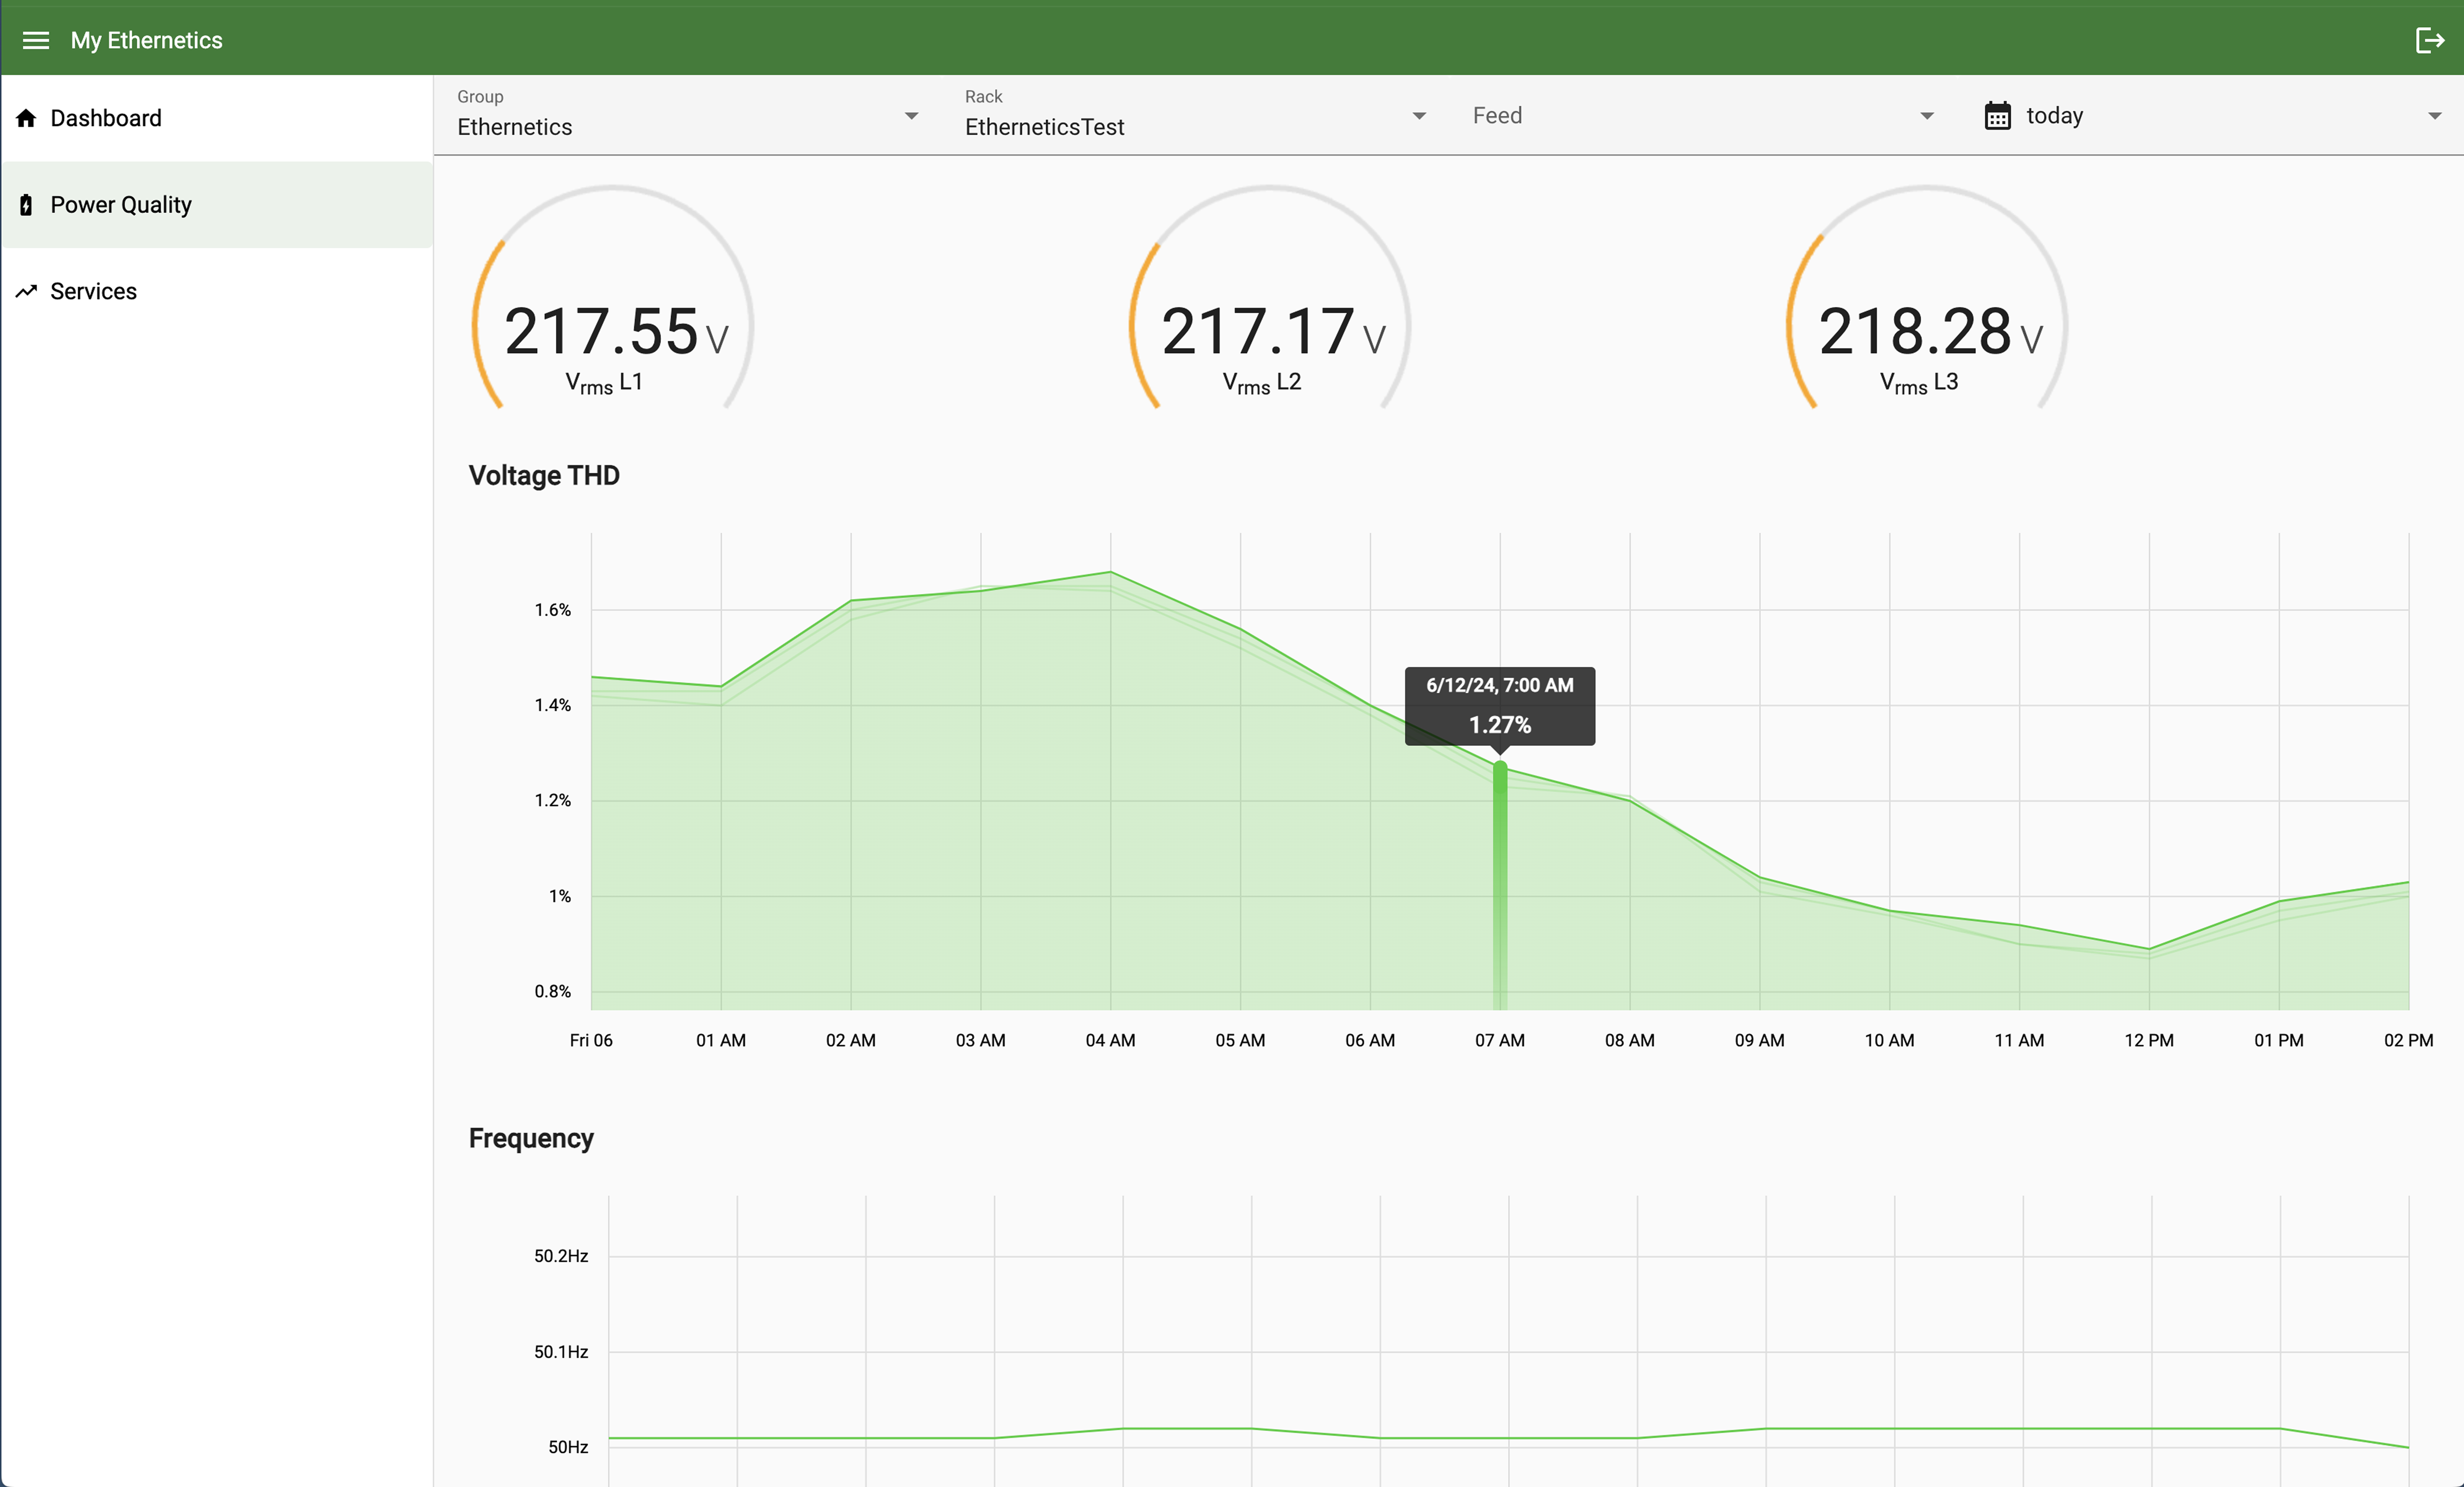
We developed a secure, scalable web platform for Ethernetics that turns complex energy data into clear, actionable insights. We built a custom dashboard powered by real-time data from Ethernetics' smart PDUs, using a robust backend with TimescaleDB and Zabbix, hosted on AWS. The front-end, built in Angular, offers customizable visualizations tailored to each user.
We also implemented multi-tenant access, role-based authentication, and a resilient cloud infrastructure, all designed to help customers reduce energy consumption and make data-driven decisions.
A complex backend
The back-end layer organizes the data using TimescaleDB; a time series database optimized for data that changes over time, which was crucial in this project. This aggregated data is then sent to the front-end application. The backend is hosted on AWS and includes several components:
1. Zabbix, a powerful data monitoring platform, collects real-time data from the customer’s server racks. However, collecting this data was not simple. Due to the large amount of data pushed every few seconds, real-time processing and visualization proved to be a significant challenge. We overcame this by adding TimescaleDB to store the large amount of data that Zabbix collects.
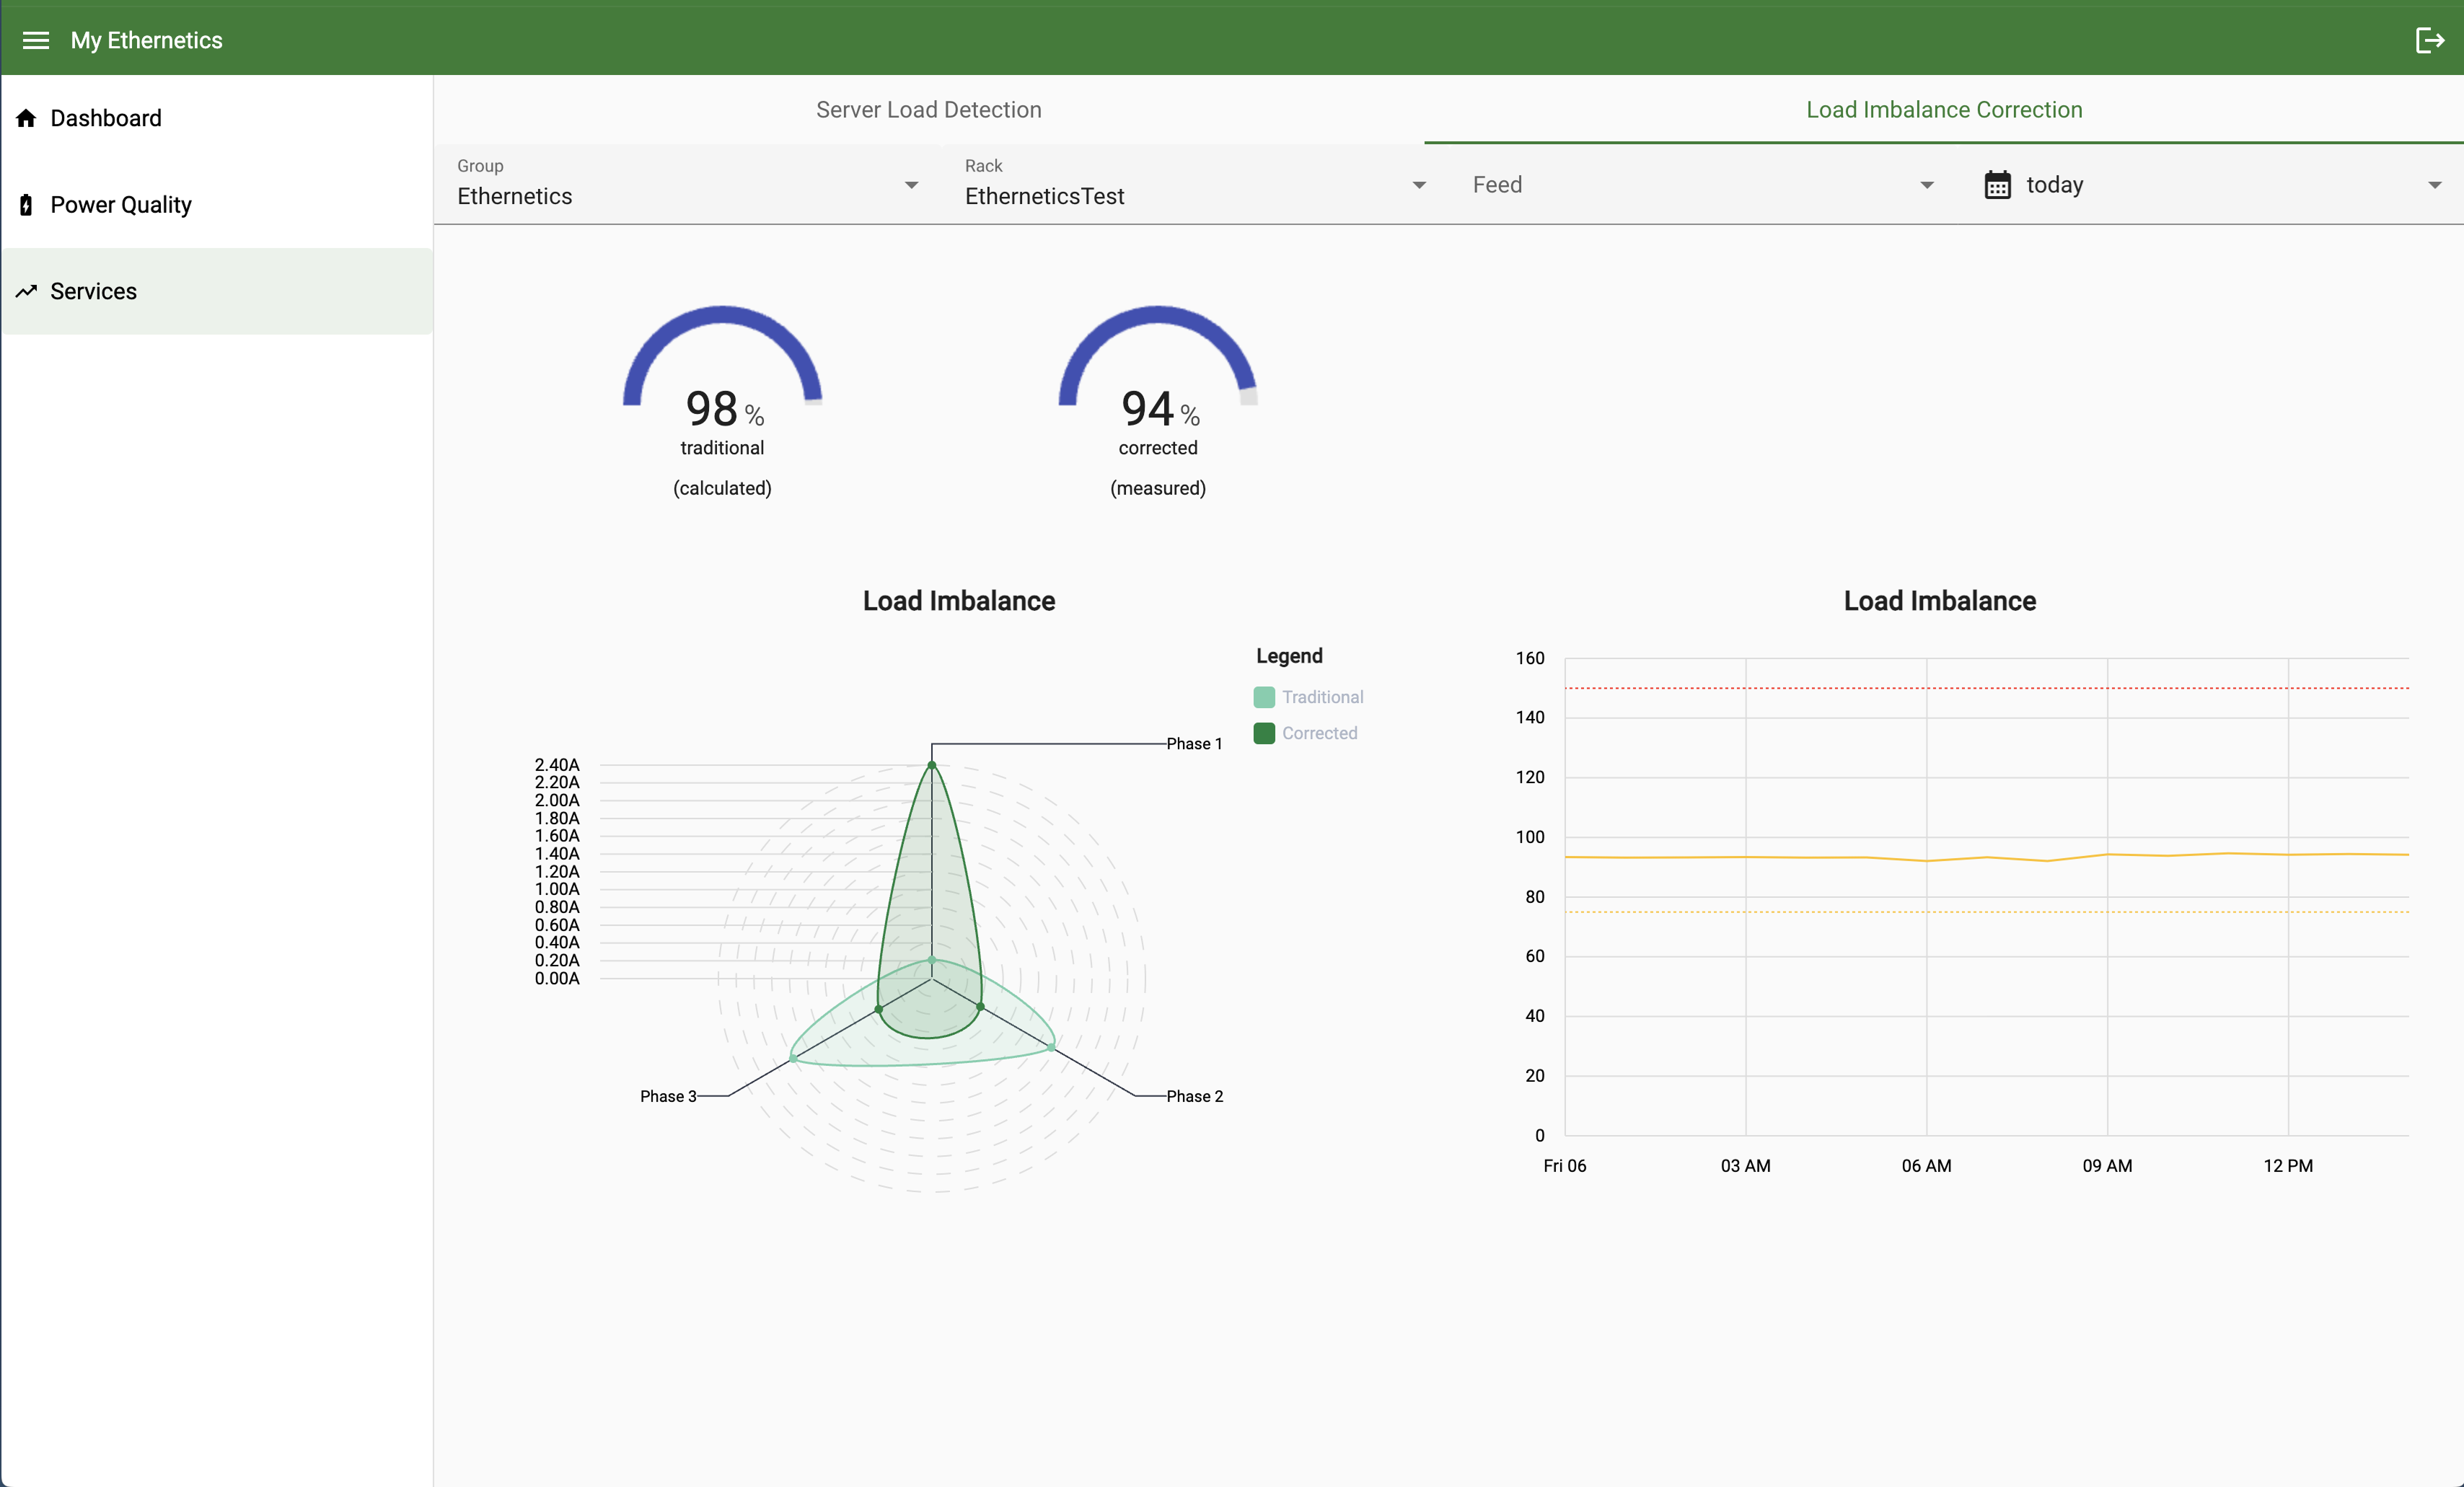
2. In this project, the backend acts as the frontend, but what does that mean? In order to optimize the front-end, the back-end service is tailored to meet the requirements of the front-end application. The back-end layer is responsible for processing the large amount of data it receives from communicating with Zabbix into manageable chunks. This process of collecting and summarizing is data aggregation. This way, the front-end layer is able to filter the data and visualize it in different graphs. This layer also implements business logic, which decides whether users are prohibited from viewing data. This ensures that customers can view their data only, not those of others. Additionally, the implemented business logic allows the front-end layer to make calculations based on raw data communicated by Zabbix, such as energy consumption, power quality, KPI scores, etc.
3. The API layer is developed to facilitate communication between the Zabbix and business logic components to implement additional features on the platform. Additionally, our API ensures the frontend application receives optimized data for visualization and user-specific needs.
4. We implemented a multi-tenant setup to guarantee clear data separation, allowing multiple parties to share the same software while keeping their data separately. This is in combination with a central IdP system, which is responsible for user authentication and RBAC, ensuring that each member can only access their own relevant data. The addition of the multi-tenant setup provides a personalized user experience while maintaining a high level of security.
Front-end designed for a personalized user experience
The frontend consists of two main components: dashboards and visualizations.
1. Every customer has different, specific monitoring needs. Hence, the web application features customizable dashboards. This way, users are able to access different views based on their specific needs, and it allows them to structure and organize their data in a way that is meaningful and relevant to them. This enables users to make data-driven decisions rather than based on their intuition.
2. In order to ensure the presented data in the dashboards is easy to understand and comprehensible, visualizations are created. By using the Javascript Data-Driven Documents library (D3), the visualizations are created dynamically, meaning that the visualizations change in response to user interaction or changes in the data collected by Zabbix. However, the visualizations were also challenging due to the large amount of data. This required careful considerations with the end-user experience in mind to ensure the platform would be easy to comprehend and use.
Cloud infrastructure optimized for the security of large data
By leveraging AWS services, we ensured the resilience of our different infrastructure components, so the system would remain operational even when faced with disruptions. Cloud functions can dynamically scale up or down depending on the demand, enabling the system to handle large amounts of data and users to maintain an optimal performance. This data is then stored and processed within EU data centers to facilitate a high level of security and full compliance with privacy and data protection regulations.
This complex system from back-end to cloud infrastructure is visualized in the image below.
An efficient collaboration
We were very excited to work on this project together with Ethernetics. The true ecological importance of Ethernetics combined with its technical and innovative approach is truly unique!
We were happy to apply our knowledge to this complex problem. Due to the result-oriented nature of this collaboration, we were able to work hands-on transparently. Ethernetics and icapps will continue working together to add more features and data streams.